Solution 5.0

05. Expand Access to Opportunity

When all residents can easily travel to various businesses and activity centers, reach a broad range of jobs, and access an education by transit or other affordable trip options, the transportation system can better support economic growth.

However, the region’s transportation system does not always provide equitable access—and, as a result, it fosters inequitable growth that inhibits the Capital Region’s economic potential.

Share of jobs accessible within 45 minutes
Vehicle Transit Bike Walk
Capital Region 28% 2% 4% 10%
Baltimore Metro 72% 4% 10% 1%
Richmond Metro 81% 3% 14% 2%
Washington Metro 62% 6% 10% 1%
Black residents more likely to live in...
Low vehicle ownership, low transit access area Concentrated poverty area
Capital Region 2.9 7.8
Baltimore Metro 1.6 12.5
Richmond Metro 2.8 5.7
Washington Metro 2.4 6

As outlined in other sections of this plan, the Partnership encourages our region to use a common definition of equitable access, and proposes the use of the following: We define equitable access as every resident of the Capital Region—regardless of his or her community, race, ability, or background—having consistent, safe, affordable, and dependable physical access to quality employment with living wages and benefits, education, and necessities that enable economic mobility and opportunity.

While the main purpose of transportation is to connect people to destinations, often minority and low-income communities lack the connectivity found in majority and high-income neighborhoods within their same region. Nationally, and within the Capital Region, historic decisions have created a transportation system that provides unequal access to jobs, healthcare, and education—often based on race. As such, transportation policies and investments have often excluded people of color from being able to easily access economic and social opportunity. The process known as redlining excluded low-income and minority communities from fair participation in housing and credit markets with discriminatory lending practices.1 Major transportation projects razed neighborhoods with majority African-American and immigrant populations, leaving remaining communities isolated and often without access to the new transportation facilities.2 In many instances, these decisions are still producing negative outcomes today.

A growing body of research literature finds that more equitable regions experience greater upward mobility and stronger, more sustained growth.3 A study of 38 metro areas with above-average economic growth between 2006 and 2016 found that over 70 percent of them were also higher performing on inclusion.4 A study of economic impacts associated with declining inequality between 1960 and 2008 attributes 15 to 20 percent of economic growth to reductions in the barriers women and blacks face in their access to skilled professions.5 When all residents can easily travel to various businesses and activity centers, reach a broad range of jobs, and access education, the transportation system better supports inclusive economic growth.

Inequitable growth inhibits the Capital Region’s economic potential. A study by PolicyLink and PERE found that Fairfax County’s rising inequality and racial gaps cost the Washington metro area $26.2 billion in potential GDP in 2012.6

Leaders in the Capital Region can support more inclusive economic growth in the region by better incorporating equitable access into our transportation plans, investments, land use decisions, and hiring. How well a transportation system serves everyone—including a region’s most vulnerable and disadvantaged populations—directly impacts the region’s overall economic growth.

Capital Region Performance

Clear disparities exist—both by income and by race—in access to opportunity afforded by the transportation system across the Capital Region.7 The average Capital Region resident can access more than 1,320,000 jobs by vehicle, 109,000 jobs by transit, 203,000 jobs by bicycle, and 25,000 jobs by walking within 45 minutes from their home.8 Within this timeframe, transit provides access to 8 percent of the total number of jobs available by vehicle region-wide.9 Black residents in the Capital Region are almost three times as likely as likely as white residents to live in areas with poor transit access to jobs and low vehicle ownership rates.10 Households in poverty are almost two-and-a-half times more likely to live in areas with poor transit access to jobs and low vehicle ownership rates.11

Analysis of the Baltimore, Washington, and Richmond metro areas finds that having access to a car is critical for residents to access jobs in activity centers as well as health centers—and to further education at universities and community colleges.

Within 45 minutes, residents who drive can access almost six times more jobs than the average transit consumer in Baltimore City.12 In the Baltimore metro area, the average resident can access over 70 percent of the almost 1.4 million jobs within 45 minutes by vehicle.13 However, transit provides residents access to only 58,000 jobs within 45 minutes—representing just 6 percent of the number of jobs available by vehicle region-wide in the same timeframe.14 In Baltimore City, black residents are three-and-a-half times more likely than white residents to live in areas with low transit accessibility to jobs and are four times more likely than white residents to live in a concentrated poverty area.15

In the Washington metro area, nearly 30 percent of residents have no transit access within 45 minutes to any of the area’s 187 activity centers.16 Black residents in the District are nearly 17 times more likely than white residents to live in areas with low transit accessibility to jobs as well as with low vehicle ownership.17 The average resident in the Washington metropolitan area can access more than 1.7 million jobs within 45 minutes by vehicle—yet just 160,000 jobs within the same amount of time traveling by transit.18

Currently, a little over half of Richmond’s low-income households are within a quarter-mile of weekday bus services—and only 50 percent of lower-wage jobs are located within a quarter-mile of a transit stop.19 Across the Richmond metro area, the average resident can access 21,000 jobs within a 45-minute transit ride, which represents just 4 percent of the number of jobs available by vehicle region-wide in the same timeframe.20 While Henrico County has made bold investments in recent budgets to enhance its transit options, transit access remains unavailable in parts of Henrico and in virtually all of Chesterfield County—the two counties where nearly 52 percent of all jobs in the metro area are located.21

Since personal vehicle ownership may be cost-prohibitive for low-income households, a transportation system lacking affordable alternatives to driving can restrict residents’ access to opportunity and their ability to fully contribute to the region’s economic growth. A successful approach is to maximize dense, mixed-use, market-rate, and affordable development near regional transit corridors. This can improve job accessibility, significantly decrease the length of unemployment for workers, increase transit ridership, and increase the region’s supply of affordable housing. In addition, the household cost savings associated with lower transportation costs allow lower-income households to redirect that spending toward other necessities such as healthy food, education, or healthcare.22

In addition, local and targeted hiring policies can further promote our region as a place of opportunity. This, in turn, impacts the area’s ability to retain and attract talent and investment. Spending by public agencies in the Capital Region is projected to be over $300 billion between 2015 and 2040.23 Investment in our workforce creates jobs and keeps more money in local neighborhoods and regions because employed residents tend to spend disposable income locally, which improves the economic strength and vitality of the region. It also brings in additional tax revenue; according to one analysis, if all Los Angeles Metro transportation projects employed targeted hire, they would generate $65 million in additional tax revenue for that region.24

Leaders in the Capital Region can support more inclusive economic growth by better incorporating equitable access into the region’s transportation plans, investments, and procurement policies.

Actions

Citations:

  1. Inclusive Transit: Advancing Equity Through Improved Access to Opportunity. Transit Center, July 2018.
  2. Ibid.
  3. Equitable Growth Profile of Fairfax County. PolicyLink and USC Program for Environmental & Regional Equity, 2015. http://nationalequityatlas.org/sites/default/files/Fairfax-Profile-6June2015-final.pdf.
  4. “Economic inclusion may be the key to lasting growth and prosperity.” Brookings, March 2018. https://www.brookings.edu/blog/the-avenue/2018/03/16/economic-inclusion-key-growth-prosperity/.
  5. Bradbury, Katharine and Robert K. Triest. Introduction: Inequality of Economic Opportunity. RSF: The Russell Sage Foundation Journal of the Social Sciences, 2(2), 1-43 (2016). Published Online: May 2016. https://www.rsfjournal.org/doi/full/10.7758/RSF.2016.2.2.01.
  6. The study estimated the percentage increase in aggregate income if age-adjusted average income (and income distributions) for six mutually exclusive racial/ethnic groups were the same as for non-Hispanic whites. Once the percentage increase in overall average annual income was estimated, 2012 GDP was assumed to rise by the same percentage. Equitable Growth Profile of Fairfax County: PolicyLink and USC Program for Environmental & Regional Equity, 2015. http://nationalequityatlas.org/sites/default/files/Fairfax-Profile-6June2015-final.pdf
  7. Greater Washington Partnership data analysis generated using Citilabs Sugar Dataset, which includes 2007-2011 ACS Data, 2012-2016 ACS Data, 2015 Longitudinal Employer-Household Dynamics Data, and Citilabs transportation networks.
  8. Ibid.
  9. Ibid.
  10. Ibid.
  11. Ibid.
  12. Ibid.
  13. Ibid.
  14. Ibid.
  15. Ibid.
  16. Ibid.
  17. Ibid.
  18. Ibid.
  19. Ibid.
  20. Ibid.
  21. Ibid.
  22. Hersey, John and Michael A. Spotts. Promoting Opportunity through Equitable Transit-Oriented Development (eTOD): Making the Case. Enterprise Community Partners, April 2015.
  23. Partnership analysis of the 2040 long-range transportation plans for the BRTB, TPB, FAMPO and RRTPO.
  24. Moving LA Forward: Promoting Construction Careers at Metro. Los Angeles: Laane, 2011. http://www.laane.org/downloads/Construction-Careers-Report-Summary-January-2011.pdf.
Expand to learn moreCollapse

Action 5.1

Increase Density and Ensure Inclusive Development in Areas Near Rapid Transit Corridors
What

Since personal vehicle ownership may be cost-prohibitive for low-income households, a transportation system lacking affordable alternatives to driving can restrict residents’ access to opportunity and their ability to fully contribute to the region’s economic growth. A successful approach is to maximize dense, mixed-use, market-rate, and affordable development near regional transit corridors. This can improve job accessibility, significantly decrease the length of unemployment for workers, increase transit ridership, and increase the region’s supply of affordable housing. In addition, the household cost savings associated with lower transportation costs allow lower-income households to redirect that spending toward other necessities such as healthy food, education, or healthcare.1

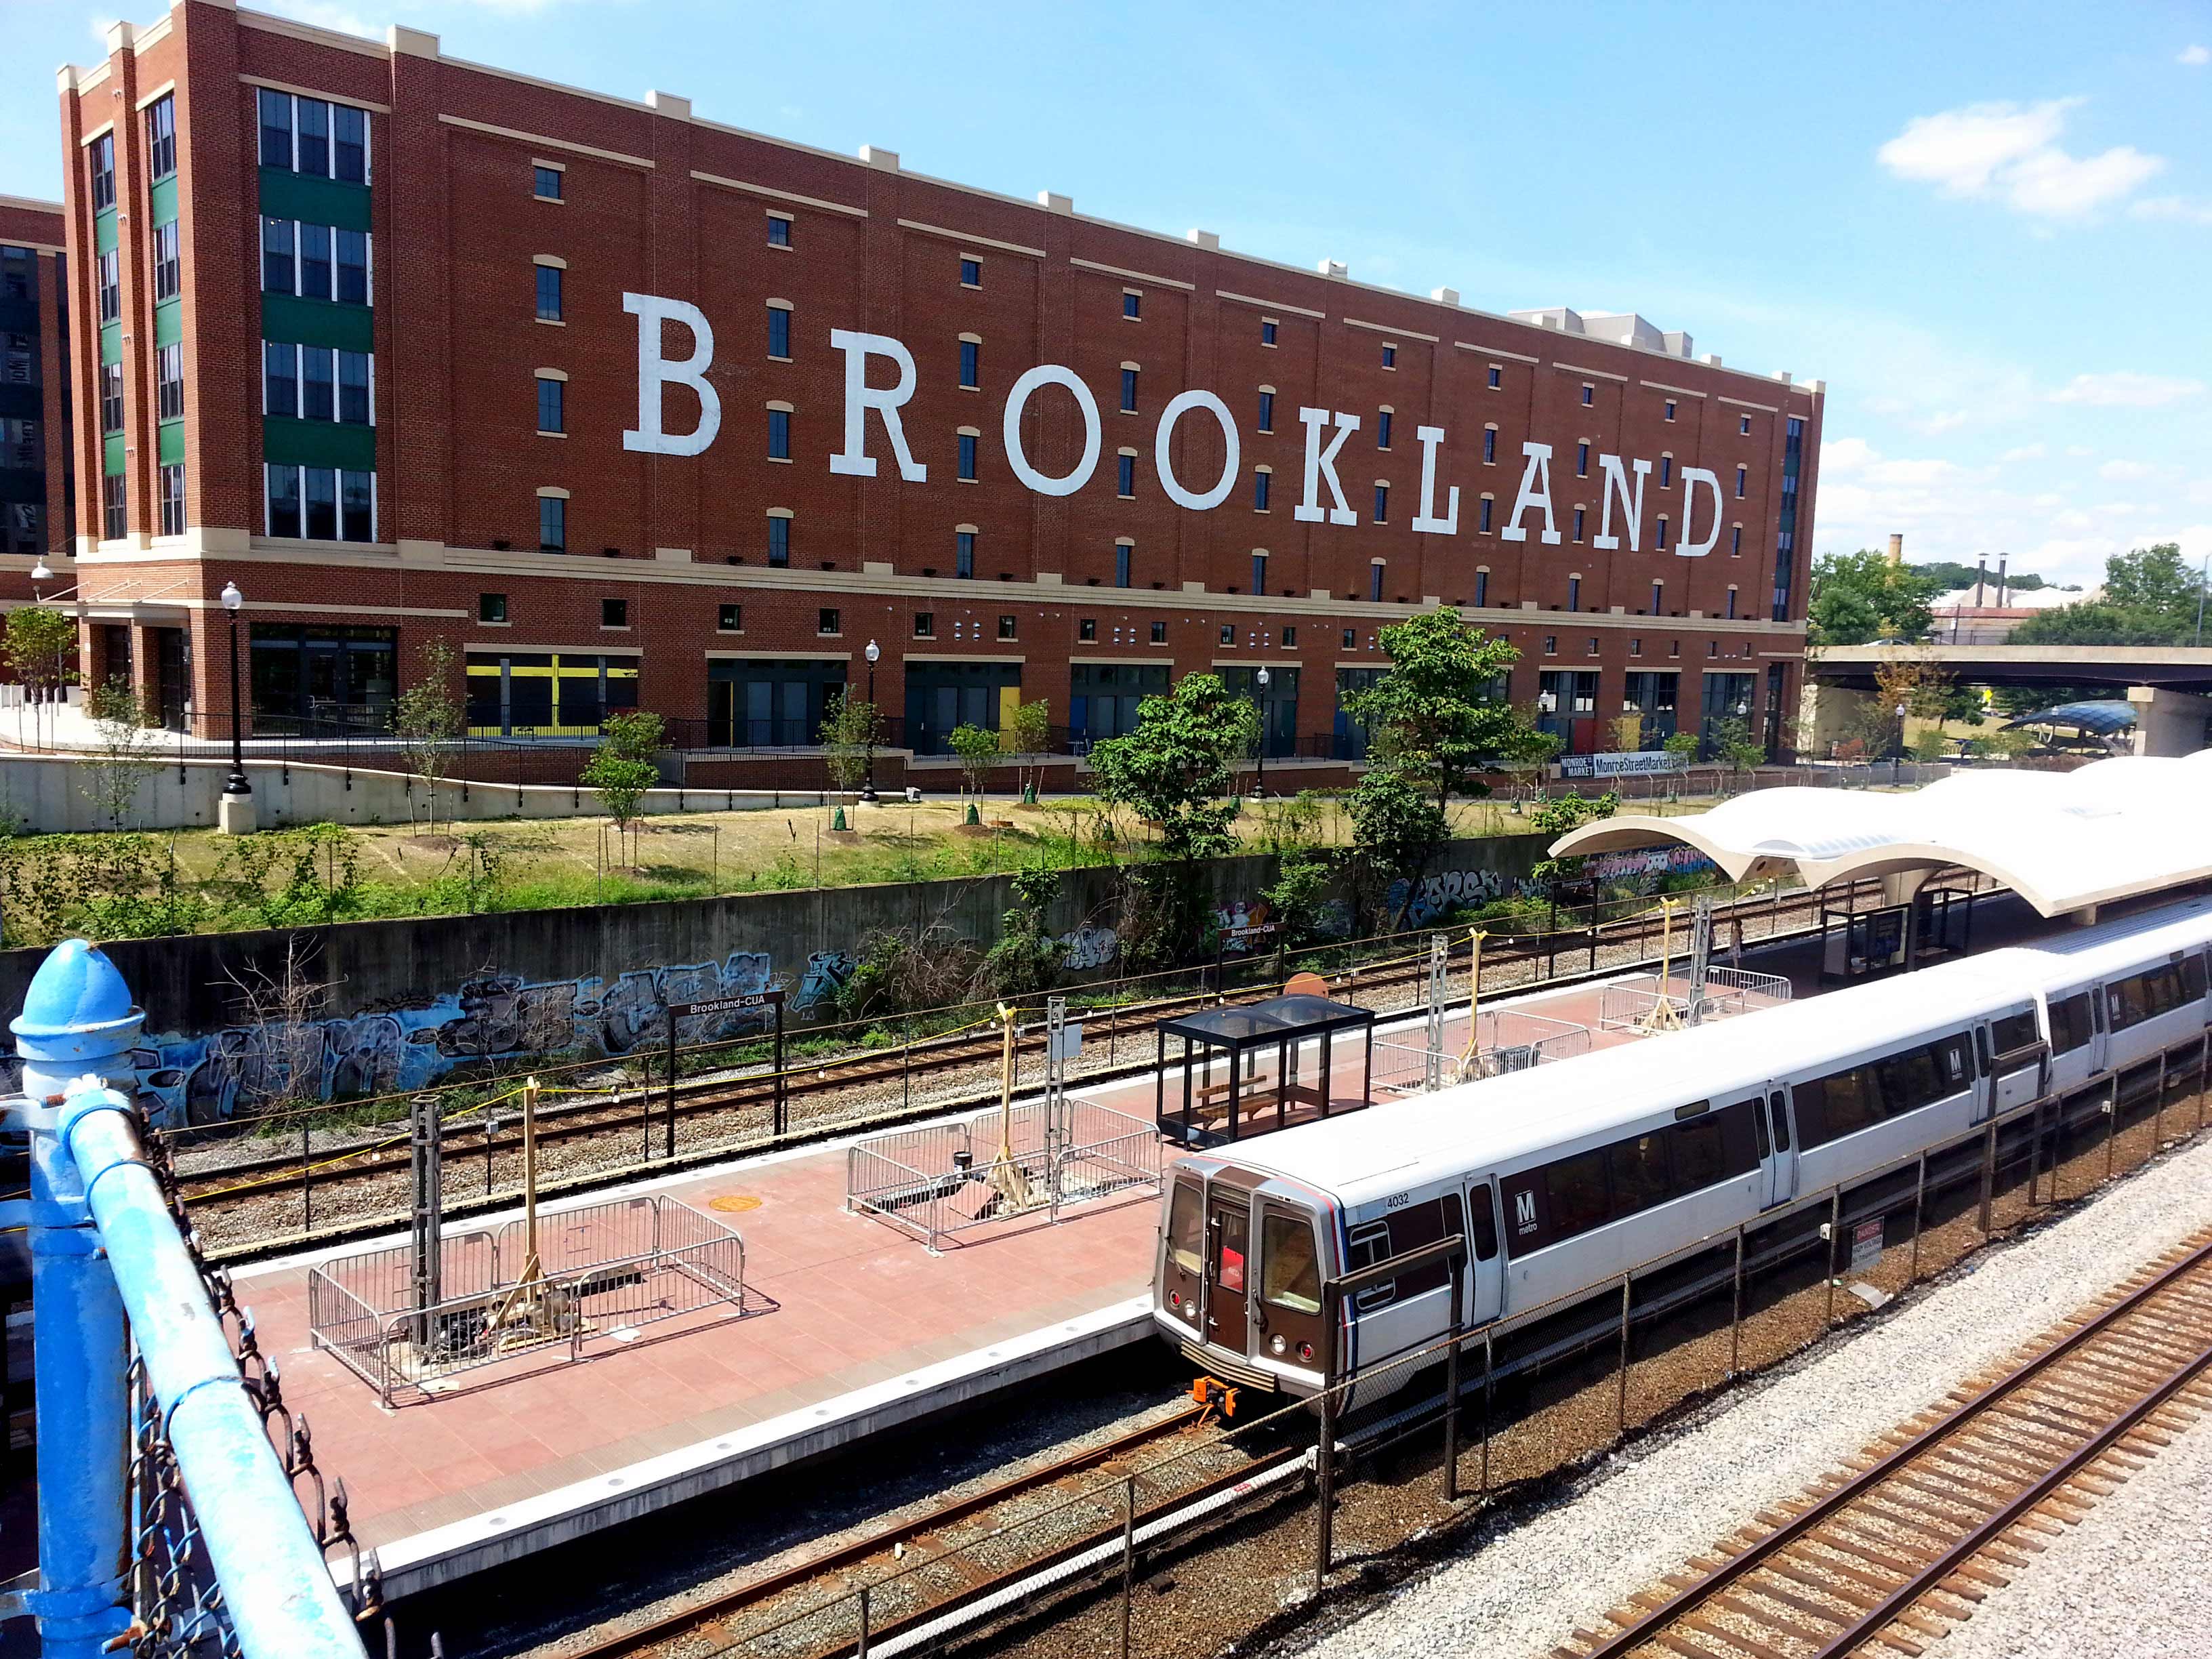
Public and private partners can promote walkable, transit-friendly development, also known as “Transit-Oriented Development” (TOD). TOD communities offer a mix of residential, retail, office, and public spaces, covering a compact area that is an average 10-minute walk—or within a quarter-mile—to a transit stop.2 This dense, transit-rich development creates high-opportunity neighborhoods through increased access to jobs, education, health centers, and other essential destinations. Investment in TOD has been proven to provide significant benefits to both the regional economy and the disinvested communities surrounding transit hubs.

Regional leadership from elected officials and civic leaders is required for the Capital Region to maximize the potential benefits from TOD projects. The Partnership urges the region’s leaders both to boost equitable development near transit stations by encouraging increased densities and to invest in preserving and growing affordable housing near rapid transit.

Why

Successful TOD generally requires dense, mixed-use development near transit stops. This development pattern can support increased transit ridership and reduce roadway congestion by increasing the jobs, housing, and activity centers accessible by transit, walking, or bicycling.

Yet, TOD projects can have the unintended effect of pricing low- and middle-income consumers out of transit-rich areas. A study of 17 TOD projects in the U.S. found that consumers have a lifestyle preference for transit-oriented living, which drives up costs when supply is constrained.3 This is occurring in the U.S., with walkable, mixed-use developments demanding a 74 percent rental premium over less dense, car-centric developments.4

Regions that are intentional in their development policies can maximize development potential near rapid transit investments while also preserving and growing affordable housing options in these opportunity-rich areas. Zoning regulations that increase development densities near transit stops, improvements to biking and walking access to transit stops, targeted investment in equitable development and preservation, and collaborative plans for new or significantly enhanced transit corridors are tools that jurisdictions around the country use to support successful TOD projects.

TOD funds and TOD affordable housing zoning regulations can help preserve and expand affordable housing options. For new or significantly enhanced transit capacity projects (e.g., the Purple Line discussed below), agencies can leverage these tools by creating community preservation and improvement plans to mitigate displacement of low- and moderate-income households and existing businesses—often those who would most benefit from transit service—as a result of new TOD development near the transit corridor. The Capital Region’s public agencies currently conduct community preservation and improvement plans on an ad hoc basis.

Benefits

Areas within the Capital Region already experience congestion relief and reduced demand on the roadway network as a result of successful TOD projects. In part due to policies that allow for dense transit-area development, between 1996 and 2012, Arlington County significantly reduced traffic across most major arterial roads despite large increases in population and economic activity.5 Montgomery County similarly focused growth in urban centers and maintained a relatively stable level of vehicle travel in the county from 2002 to 2012 despite an increase of 100,000 residents.6

Intentional preservation and expansion of affordable housing options in the TOD corridor enhance economic opportunities for low- and middle-income families. In a study of nine metropolitan areas, the better job accessibility provided by the connections to transit was found to significantly decrease the length of unemployment for certain lower-paid workers who had recently lost their jobs.7 In addition, the household cost savings associated with lower transportation costs allow lower-income households to redirect that spending toward other necessities such as healthy food, education, or healthcare. A study by the Illinois Housing Development Agency found that households in transit-rich neighborhoods saved an average of $3,000 per year in transportation costs compared to neighborhoods without transit access.8

Through extensive engagement with public, private, and community stakeholders, the Purple Line Corridor Coalition in Maryland established a Community Development Agreement that laid out both a vision for development along the new light rail line and strategies to achieve that vision. Though the agreement is not legally enforceable, its signatories are committed to achieving the shared vision outlined by the Coalition, which is important to holding all parties accountable to its long-term success. The Community Development Agreement identifies specific goals and actions to ensure the project achieves job, housing, and mobility benefits. For example, the agreement takes stock of the existing affordable housing along the corridor and calls for maintaining and improving the current stock, if necessary, by recommending legislation.9

In San Francisco, the Bay Area Transit-Oriented Affordable Housing (TOAH) Fund leveraged an initial $10 million in seed capital from the region’s metropolitan planning organization (MPO)—the Metropolitan Transportation Commission (MTC)—to raise an additional $40 million from private, non-profit, and philanthropic sources.10 The TOAH Fund can award funds to development projects located within a half-mile of rapid transit service and that include affordable housing or other community services, such as child care centers, fresh food markets, and health clinics.11 In the first three years of operation, the TOAH Fund deployed over $30 million in capital—creating nearly 900 affordable housing units and expanding community-serving retail near rapid transit stops.12 In 2015, MTC further capitalized the Fund with an additional $10 million.13

In Seattle, the city’s housing authority allows developers to build at higher densities on sites near transit stations if the development meets mixed-income housing requirements.14 As a result, the city’s Yesler Terrace redevelopment is replacing 561 public housing units for families earning no more than 30 percent of the area median income and creating up to 1,100 additional low-income units.15 The project will also include 1,200 to 3,200 market-rate homes.16

Barriers

Like most areas of the country, the Capital Region’s transit investments are funded at the regional or state level, but are economically impacted by zoning regulations determined at the local level. In many instances, Capital Region development projects face opposition from residents who want to maintain the exclusivity of the area by keeping TODs and transit-dependent populations outside of the neighborhood. This real or perceived opposition further disincentivizes development and pushes development toward lower-income areas of the region where residents would benefit from the investment but are more likely to be unable to afford the increased costs that come with the development. It also can increase the cost for transit service by lowering ridership. For example, the Washington Metropolitan Area Transit Authority (WMATA) estimates a loss of 200 trips per day and $121,500 in annual fare revenue foregone due to the District’s decision to reduce the size of a TOD development project near the Rhode Island metro station by nearly 200 housing units and 50,000 square feet of retail space.17

Next moves

Currently, TOD is underutilized along the Virginia Railway Express (VRE) and Maryland Area Regional Commuter (MARC) commuter rail corridors in the Baltimore and Richmond regions as well as many of the eastern stations in the Washington metro area. However, it is a dominant development pattern in the District and many stations in Montgomery County and Northern Virginia. The Capital Region should maximize development in TOD areas through zoning changes, improving pedestrian and bicycle access to transit stops, and intentionally focusing on preserving and growing affordable housing near transit stops.

Next moves are:

  • Local governments, with support from the region’s MPOs and transit agencies, should conduct zoning and accessibility studies for each rail and high-frequency transit stop to maximize density, affordable housing, and ridership potential
  • Maryland, the District, Virginia, and local governments, should adopt economic development regulations that prioritize and incentivize inclusive TOD in locations with a mix of jobs, schooling, housing, and rapid transit connections
  • State and local jurisdictions should adopt laws requiring corridor community preservation and improvement plans be completed no less than 12 months prior to a new rapid transit corridor project opening
  • The Capital Region’s public and private employers should prioritize multimodal access as a key factor in future job site selections—and public agencies should incentivize this development pattern
  • Maryland, the District, and Virginia—in partnership with MPOs and local jurisdictions—should use public funding to attract private resources to capitalize a regional Equitable Access TOD Fund

Costs

The regional and local economic benefits—including increased employment, property and sales tax revenue, and increased transit ridership—from inclusive, transit-oriented growth are expected to exceed the costs associated with changing zoning requirements and developing studies and plans.

Citations:

  1. Hersey, John and Michael A. Spotts. Promoting Opportunity through Equitable Transit-Oriented Development (eTOD): Making the Case. Enterprise Community Partners, April 2015.
  2. Transit-oriented development is “a mixed-use community within an average 2,000-foot (or 10-minute) walking distance of a transit stop and core commercial area. TODs mix residential, retail, office, open space, and public uses in a walkable environment, making it convenient for residents and employees to travel by transit, bicycle, foot, or car.” Calthorpe, Peter. The Next American Metropolis: Ecology, Community, and the American Dream. Princeton: Princeton Architectural Press, 1993. Hess, Daniel Baldwin and Peter A. Lombardi. “Policy Support for and Barriers to Transit-Oriented Development in the Inner City: Literature Review.” Transportation Research Record: Journal of the Transportation Research Board, Volume 1887. https://doi.org/10.3141/1887-04.
  3. National Academies of Sciences, Engineering, and Medicine. Effects of TOD on Housing, Parking, and Travel. Washington, DC: The National Academies Press, 2008. https://doi.org/10.17226/14179.
  4. Leinberger, Christopher B. and Michael Rodriguez. Foot Traffic Ahead: Ranking Walkable Urbanism in America’s Largest Metros. Smart Growth America, LOCUS, and The George Washington University School of Business, 2016. https://www.smartgrowthamerica.org/app/legacy/documents/foot-traffic-ahead-2016.pdf.
  5. “As Arlington booms, traffic drops.” Greater Greater Washington, June 2014. https://ggwash.org/view/35122/as-arlington-booms-traffic-drops.
  6. Mobility Assessment Report. Montgomery County, MD: Montgomery County (MD) Planning Department, April 2014. http://www.montgomeryplanningboard.org/agenda/2014/documents/MobilityAssessmentReport2014-DRAFT4-9-2014_000.pdf.
  7. According to analysis conducted by the National Bureau of Economic Research. Hersey, John K and Michael A. Spotts. Promoting Opportunity through Equitable Transit-Oriented Development (eTOD): Making the Case. Enterprise, April 2015.
  8. Ibid.
  9. “Pathways to Opportunity: Purple Line Corridor Action Plan.” Purple Line Corridor Coalition, Fall 2017. http://purplelinecorridor.org/wp-content/uploads/2017/10/PLCorridorActionPlan2017.pdf.
  10. Hersey, John K. and Michael A. Spotts. Promoting Opportunity through Equitable Transit-Oriented Development (eTOD): Barriers to Success and Best Practices for Implementation. Enterprise, October 2015.
  11. Ibid.
  12. “Metropolitan Transportation Commission Approves $10 Million New Investment in Bay Area Transit-Oriented Affordable Housing Fund.” Oakland, CA: Low Income Investment Fund, June 2015. http://www.liifund.org/news/post/metropolitan-transportation-commission-approves-10-million-new-investment-in-bay-area-transit-oriented-affordable-housing-fund/.
  13. Ibid.
  14. Hersey, John K and Michael A. Spotts. Promoting Opportunity through Equitable Transit-oriented Development (eTOD): Barriers to Success and Best Practices for Implementation. Enterprise, October 2015.
  15. “Redevelopment of Yesler Terrace.” Seattle Housing Authority. https://www.seattlehousing.org/about-us/redevelopment/redevelopment-of-yesler-terrace.
  16. Hersey, John K and Michael A. Spotts. Promoting Opportunity through Equitable Transit-oriented Development (eTOD): Barriers to Success and Best Practices for Implementation. Enterprise, October 2015.
  17. “WMATA’s Transit-Oriented Development Objectives.” Capital and Strategic Planning Committee Item III - B. WMATA, April 2018.https://www.wmata.com/about/board/meetings/board-pdfs/upload/3B-WMATA-TOD-Policy.pdf.
Expand to learn more Collapse
Action 5.2

Adopt Local and Targeted Hiring, Procurement, and Contracting Policies

What

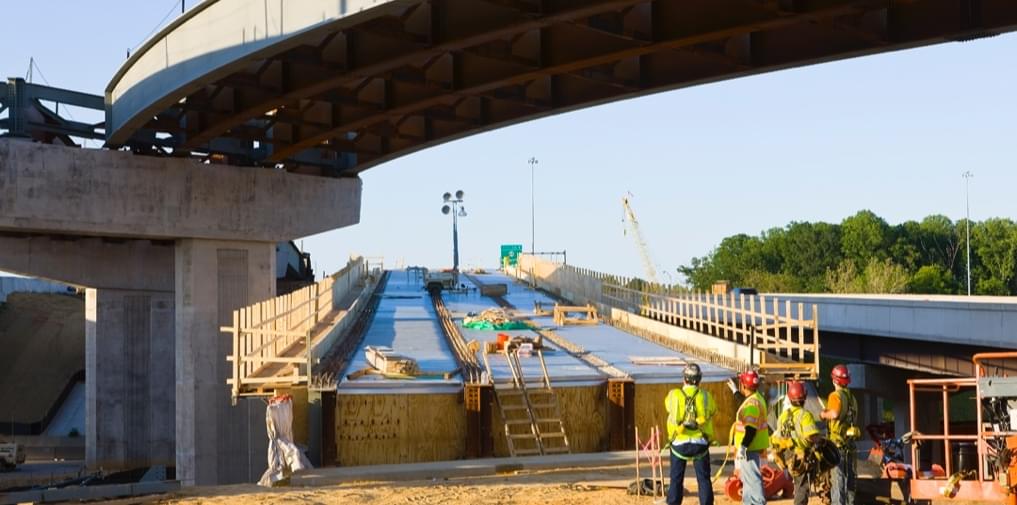
Public agencies spend a significant amount of money each year on construction projects. In the Capital Region, this spending is projected to be over $300 billion between 2015 and 2040.1 Some jurisdictions leverage their buying power to ensure local residents or economically disadvantaged community members are given priority for new jobs created by these publicly-funded projects.

When procuring work for a construction project, the public sector can give preference to contractors and developers who provide family-supporting jobs to local residents, veterans, and workers in disadvantaged communities with high unemployment by establishing inclusive and responsible contracting that generates quality jobs and community benefit through local law, regulation, or agency policy.2 By adopting consistent local and targeted hiring policies in the Capital Region, we can better leverage public dollars to address unemployment and support equitable economic development.

Why

Local and targeted hiring policies, combined with inclusive and responsible contracting policies, maximize the local economic benefits from transportation spending by investing in local talent and providing economically disadvantaged residents not only with quality paying jobs but also with career pathways. Local and targeted hiring policies lead to greater investment in (and retention of) local labor; a greater likelihood that transportation investments benefit the broad regional economy; increased opportunity for targeted groups, which can save public money over the long term; and improved ability for the labor pool to respond to changing demands.

Transportation infrastructure construction offers a tremendous chance to ensure public resources are used to open up new career opportunities to area residents. A well-executed worker recruitment plan can maximize the benefit and expand the job potential for underserved communities. This has proven successful through partnerships with community-based organizations to provide soft skills training and with construction apprenticeship readiness programs that have proven track records of placing graduates into multi-employer programs. Utilizing these programs can build a skilled workforce that in turn will lift the region’s economy by increasing the long-term supply of highly skilled construction workers. These workers can then seek employment with multiple contractors as projects wind down and new ones are started.

In the Capital Region, jurisdictions have different standards for local and targeted hiring preferences in their procurement process. For Baltimore, the District, and Prince George’s County, each local hiring goal is set at 51 percent of all new hires on projects receiving local public dollars.3 Across the region, certain project size thresholds trigger other requirements; in the District, larger projects must meet additional local and targeted hiring requirements.4 In Baltimore, smaller projects must work with the Office of Economic Development and the Mayor’s Office to help promote job availabilities.5 In Virginia, various municipalities give preference in the procurement process to local or in-state bidders.

Historically, local hire provisions have been prohibited for transportation projects receiving federal funding.6 However, a recent federal pilot program7 allowed transportation agencies to use local hiring or hiring based on economic status—such as low-income households or veterans—in procurement processes for highway and transit projects receiving federal dollars. The Capital Region received federal approval for eight pilot projects—two led by the District Department of Transportation (DDOT), one led by the Baltimore City Department of Transportation (BDOT), and five projects led by the Virginia Department of Transportation (VDOT).8 Despite broad interest throughout the country and in our region, the pilot program has since been terminated. With a significant share of the Capital Region’s transportation dollars coming from the federal government, greater flexibility of procurements that use federal dollars will be key in maximizing the region’s return on its transportation investments.

Federal requirements9 encourage small businesses owned by socially and economically disadvantaged individuals to participate in federally-assisted contracts. In addition, some transit agencies have given extra credit to bidders who provide opportunities to unemployed and disadvantaged workers by incorporating a contractual provision known as the U.S. Employment Plan (USEP) into their requests for proposals.10 In 2016, the U.S. Department of Transportation (USDOT) released a letter acknowledging its support of USEP language, which it approved for use in the procurement of rolling stock for various transportation agencies, including the Maryland Department of Transportation (MDOT).11

Benefits

Greater investment in local labor promotes the perception and reality of the area as a healthier community—and the larger region as a place of opportunity. This, in turn enhances the area’s ability to retain and attract talent and investment. It also brings in additional tax revenue; according to one analysis, if all L.A. Metro transportation projects employed targeted hire procurement practices, they would generate $65 million in additional tax revenue.12 Economic inclusion keeps more money in local neighborhoods and regions because employed residents tend to spend disposable income locally—improving the economic strength and vitality of the region. In Los Angeles County, data from the Los Angeles Unified School District certified payroll system reported that work generated by their targeted hire program resulted in approximately $1.02 billion in wages for Los Angeles County residents between 2004 and 2011.13 Economic inclusiveness also fosters productivity and regional benefits through increased employment and a reduction in the number of people who require public assistance or are incarcerated. This is beneficial for both the people who need jobs and the public that benefits from the overall cost savings.14 Local and targeted hiring policies can also help the public and private sector respond to demographic and policy change. For example, loss of “baby boomer” workers will create labor shortages—making cultivating the local workforce key for businesses, anchor institutions, and government agencies to meet the labor requirements of today and the future.15

Barriers

The greatest barrier to regional adoption of local and targeted hiring policies is the restriction by the federal government on using these common-sense policies for projects incorporating federal grants or loans. This results in needing two procurement standards and processes for jurisdictions that adopt local and targeted hiring policies—one for projects receiving funds from the federal government and one for projects funded without a single federal government dollar.

Some local hire policies have folded in court, highlighting the importance of crafting policies that withstand potential legal scrutiny. Local and targeted hiring policies better withstand legal challenges when 1) they are closely tied to an agency’s goal (e.g., decreasing local unemployment); 2) they establish a hiring goal rather than a quota; and 3) the agency demonstrates that the local, targeted hiring policy will help alleviate a discrete, identifiable problem (e.g., unemployment).16 To justify using local and targeted hiring provisions, public agencies should gather supporting data on economic disadvantage in the community and should periodically re-evaluate the need for these provisions.

Next moves

Local and targeted hiring procurement policies can increase the region’s economic productivity while also increasing upward economic mobility for targeted populations. The region has planned over $300 billion in transportation spending over the next 20 years,17 and we should do our best to create pathways to economic growth and prosperity for those most affected by our largest projects. We should also maximize creation of jobs paying family-supporting wages for the region’s population. This will require a supportive federal partner that empowers state and local jurisdictions to apply local and targeted hiring policies to transportation projects receiving federal funding support. This can be accomplished through reinstatement of the pilot program or permanent changes to allow local and targeted hire policies.

Next moves are:

  • State and local transportation agencies should adopt local and targeted hiring and contracting policies to maximize the region’s return on transportation investments and ensure family-supporting wages
  • The congressional delegation should empower local and state governments to use local and targeted hiring practices for all federally funded transportation projects
  • Community-based organizations and construction apprenticeship readiness programs should be deployed to increase job placement for local residents

Costs

Results from the federal local and targeted hire pilot program indicate that local and targeted hiring provisions do not create significant additional costs. For example, under a pilot project in San Bernardino County, California, early evaluation of the project showed the hiring incentive resulted in 30 percent local labor and had no impact on the number of bids received, the construction cost, or the unit cost.18

Citations:

  1. Partnership analysis of the 2040 long-range transportation plans for the BRTB, TPB, FAMPO and RRTPO.
  2. “Responsible Contracting: Best practices.” Fact Sheet. National Employment Law Project, April 2017. https://www.nelp.org/wp-content/uploads/responsible-contracting-best-practices.pdf
  3. Article 5, Section 27. Baltimore City Code. http://ca.baltimorecity.gov/codes/Art%2005%20-%20Finance.pdf ; “First Source Program.” Department of Employment Services. https://does.dc.gov/sites/default/files/dc/sites/does/page_content/attachments/First%20source%20program%20info_factsheet.pdf ; Obstacles & Opportunities: The Workforce Development Landscape in Prince George’s County, Maryland. Job Opportunities Task Force Special Report - Executive Summary, September 2013. https://jotf.org/wp-content/uploads/2018/06/Prince-Georges-Workforce-Report-Final-smaller1.pdf
  4. “First Source Program.” Department of Employment Services. https://does.dc.gov/sites/default/files/dc/sites/does/page_content/attachments/First%20source%20program%20info_factsheet.pdf
  5. “Revised Employ Baltimore Executive Order.” City of Baltimore Memo, December 2013. http://moed.baltimorecity.gov/sites/default/files/Employ_Baltimore_exec_order_revised.pdf
  6. Under the Reagan administration, many cities sought to withhold contracts from companies that did business with apartheid South Africa. However, the Justice Department ruled in favor of the Reagan administration, citing language that all government transportation contracts must abide by “full and open competition.” Since then it has been difficult for cities to add provisions that support local-hire, LGBTQ protections, climate change considerations, or other community goals. “When Cities Fought the Feds Over Apartheid.” CityLab, May 2017. https://www.citylab.com/equity/2017/05/when-cities-fought-the-feds-over-apartheid/527634/.
  7. The SEP-14 one-year pilot program was first authorized on December 18, 2015, and received extensions allowing the program to run through March 6, 2022. However, on October 6, 2017, USDOT published a Federal Register Notice terminating the program. Each approved project is required to produce an evaluation to determine the impact of its proposed hiring plan in terms of meeting the hiring goals as well as any impact on project costs and maintained historic levels of competition in bidding.
  8. “Special Experimental Project No. 14 - Local Labor Hiring Pilot Program and Livability Initiative Pilot Program.” USDOT Federal Highway Administration, September 2018. https://www.fhwa.dot.gov/construction/cqit/sep14local_projects.cfm
  9. State and local transportation agencies must establish DBE participation goals, evaluate progress toward these goals, and be consistent in attaining them. The federal Disadvantaged Business Enterprise (DBE) program supports for-profit small businesses in which the individual who owns at least 51 percent of the business belongs to a socially or economically disadvantaged group. “Definition of a Disadvantaged Business Enterprise.” U.S. Department of Transportation, November 2017. https://www.transportation.gov/civil-rights/disadvantaged-business-enterprise/definition-disadvantaged-business-enterprise.
  10. “U.S. Employment Plan Fact Sheet.” Jobs to Move America. https://jobstomoveamerica.org/wp-content/uploads/2015/10/USEP-fact-sheet-1.pdf
  11. “Letter from U.S. Transportation Secretary Anthony Foxx - U.S. Employment Plan.” Federal Transit Administration, February 2016. https://www.transit.dot.gov/funding/procurement/letter-us-transportation-secretary-anthony-foxx-%E2%80%93-us-employment-plan
  12. Moving LA Forward: Promoting Construction Careers at Metro. Los Angeles, CA. Laane, 2011. http://www.laane.org/downloads/Construction-Careers-Report-Summary-January-2011.pdf.
  13. Uyen Le. Project Labor Agreements: Pathways to Business Ownership and Workforce Development in Los Angeles. Los Angeles, CA. UCLA Labor Center, 2011. http://constructionacademy.org/wp-content/uploads/downloads/2012/03/LAUSD-PSA-Small-Business-Participation-CCA-11-18-11.pdf.
  14. Opportunity for growth: How reducing barriers to economic inclusion can benefit workers, firms, and local economies. Brookings, September 2017. https://www.brookings.edu/research/opportunity-for-growth-how-reducing-barriers-to-economic-inclusion-can-benefit-workers-firms-and-local-economies/
  15. Collectively We Rise: The Business Case for Economic Inclusion in Baltimore. Baltimore, MD. Baltimore Integration Partnership, 2018. https://baltimorepartnership.org/wp-content/uploads/2018/06/BIP_EconomicInclusion_FullReport_ReducedFileSize_06202018.pdf.
  16. National Academies of Sciences, Engineering, and Medicine. Enforceability of Local Hire Preference Programs. Washington, DC: The National Academies Press, 2013. https://www.nap.edu/read/22591/chapter/7.
  17. Partnership analysis of the 2040 long-range transportation plans for the BRTB, TPB, FAMPO and RRTPO.
  18. “Special Experimental Project No. 14 Report for Pilot Program—Local and Veteran Hiring Incentive.” Communication from San Bernardino Associated Governments to the California Department of Transportation Division of Local Assistance, June 2016. https://www.fhwa.dot.gov/programadmin/contracts/sep14ca160628.pdf.
Expand to learn more Collapse

Contact Us

Phone Number

General Inquiries

202 765 2024

Email Address

[email protected] [email protected]
Sign Up For Updates