Solution 3.0

03. Create High-Performing Public Transit

Public transportation plays a crucial role in moving people around the Capital Region—providing nearly two million trips, on average, each weekday.1 Of the five million workers in the region, about one in 10 takes public transportation to work.2 At least 30 different agencies provide some form of public transportation in the region, including local and commuter buses, light rail and subways, commuter rail, vanpools, ferries, and paratransit.3

Public transportation provides multiple economic benefits. For some people, it is the only means of accessing the jobs or education needed for upward mobility. For others, it provides a cost-effective way to get around—freeing up resources to save or spend in the regional economy. High-quality, frequent transit can also increase the value of nearby property and can reduce the need to provide parking, which saves money for building owners and developers.

However, public transportation ridership is declining throughout the region. While this decline mirrors a national trend, the Capital Region’s rate of ridership decline from 2010 to 2017 far exceeded the national average.4 Declining public transportation ridership can adversely impact the region’s economy and increase congestion on our roadways. Declining ridership also increases operating costs for the service, which represents a drain on our municipal budgets and can lead to service cuts. As service levels decline, access to jobs is constrained and employers’ potential talent pool shrinks.

Ridership Trends (unlinked passenger trips)

2002-2009 2010-2017
U.S. total +15% +3%
Capital Region total +17% -16%
Baltimore metro area +8% -19%
Washington metro area +19% -15%
Richmond metro area -2% -23%

Source: TransitCenter analysis of National Transit Database data. Metro area totals include all transit systems within the metro area.

Access to jobs via public transportation

% of Jobs accessible by car within 45 minutes % OF TOTAL JOBS ACCESSIBLE BY TRANSIT WITHIN 45 MINUTES
Baltimore 72% 4%
Washington 62% 6%
Richmond 81% 3%

Source: Greater Washington Partnership analysis generated using Citilabs Sugar Dataset

Share of regional workers without access to a car

Total Workers Without Car Transit Commuters Without Car
Capital Region 5% 25%
Baltimore metro area 5% 35%
Washington metro area 6% 23%
Richmond metro area 3% 36%

Source: U.S. Census American Community Survey

The Capital Region has already made significant investments in public transportation, but more needs to be done. The region should prioritize public transportation in its planning and funding decisions. Other mobility options—such as carshare, bikeshare, and rideshare—should be leveraged to complement public transportation. With increased coordination, transit agencies and state and local governments can create a seamless, integrated network of high-performing public transportation options to serve the region’s mobility needs.

Capital Region Performance

Public transportation in the Capital Region provides nearly two million trips each day—reducing congestion and emissions and providing affordable access to jobs and services. Public transportation is particularly important for older adults, young employees, lower-income residents, students, the disabled, and those who do not own cars. While only about 5 percent of workers in the Capital Region lack regular access to a vehicle, about a quarter of transit commuters lack cars.5 For the Baltimore and Richmond metro areas, that figure is more than one-third.6 Limited transit service in these areas denies access to upward economic mobility for many people—and limits the region’s ability to grow.

Large gaps still exist in the Capital Region’s public transportation network, putting many jobs and activity centers out of reach except by car. While recent efforts to improve bus networks in Richmond and Baltimore have increased job access in some places, commuters who rely on transit still cannot get to jobs in many parts of the region within a reasonable timeframe—particularly in suburban areas. This gap denies too many people access to opportunity.

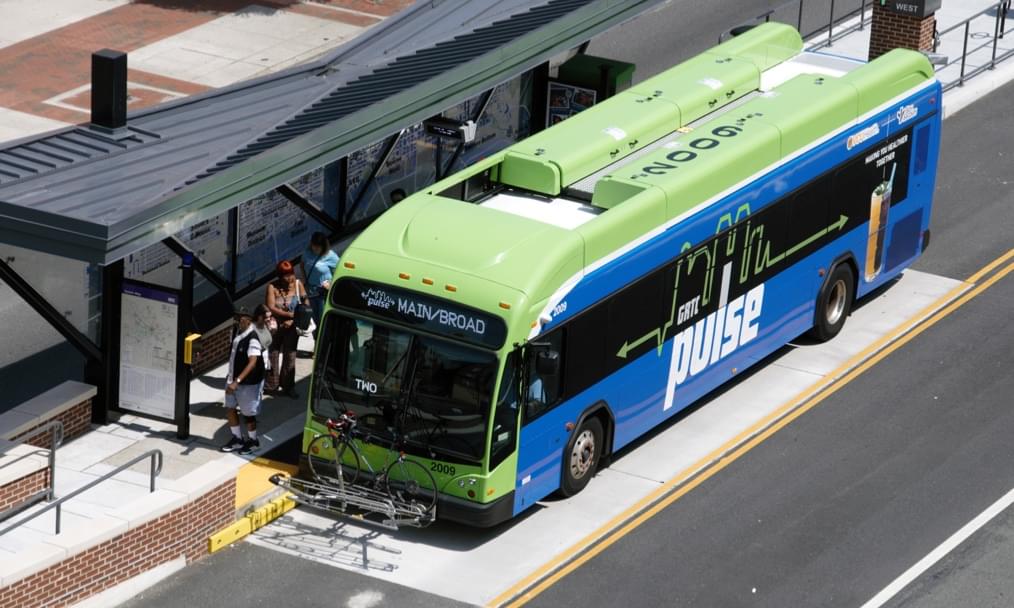
The region’s bus networks—the primary transit vehicle in much of the region—often lack adequate political support to close these service gaps, and properly coordinate and prioritize efficient bus movement. The entire Capital Region has just 12.5 miles of dedicated bus lanes, which are proven to increase the speed, reliability, and ridership of buses.7 Of the thousands of intersections in the region, there are just over 300 intersections enabled with transit signal priority (TSP), which prioritizes bus movement through the intersections to reduce trip times and improve reliability.8 Richmond’s new Pulse bus rapid transit (BRT) is the only bus service in the region that allows off-board fare payment to speed up boarding. In comparison, San Francisco MTA buses have used all-door boarding and tap-and-go fare collection since 2012.9 Seattle’s deployment of dedicated bus lanes, bus priority at intersections, higher frequency routes, and faster fare payment has led to a 16 percent increase in bus ridership since 2010.10

Many regional entities have public transportation improvement plans, but the Capital Region lacks a coordinated strategy for identifying and implementing priority projects. Improving the performance of the region’s public transportation systems will require coordinated action by multiple agencies. Maryland Transit Administration’s (MTA) new high-frequency network requires bus-only lanes and traffic signal changes on downtown roads owned by the City of Baltimore. Washington Metropolitan Area Transit Authority’s (WMATA) new mobile fare payment system will need to integrate with other bus and rail systems in the region that use the SmarTrip card. The Greater Richmond Transit Company (GRTC), the city of Richmond, and Henrico County successfully launched the Pulse BRT along Broad and Main Streets, but the region has no strategy for delivering the next phase of transit improvements.

By working together, the various public transportation agencies across the region can offer higher-quality and more expansive service—and attractive fares—that can better compete with other transportation options and increase ridership. In Hamburg, Germany—a metro area with roughly the same population served as WMATA—the public transportation association coordinates 29 public transportation operators, and has successfully grown ridership across the metro area by 72 percent from 1990 to 2015, to more than 750 million trips annually.11 That’s nearly twice as many trips as WMATA provided in 2015.12 In addition to increased ridership, more frequent and reliable public transportation in the Capital Region will improve access to essential destinations—opening up a wider range of employment and educational opportunities for residents.

Actions

Citations:

  1. National Transit Database, 2016.
  2. Partnership analysis of U.S. Census American Community Survey data.
  3. Includes all agencies providing service in the Capital Region that reported to the National Transit Database in 2016.
  4. “TransitCenter’s NTD Transit Ridership Analysis, 2002-2017,” TransitCenter, May 2018, https://transitcenter.org/2018/05/01/ transitcenters-ntd-transit-ridership-analysis-2002-2017.
  5. Partnership analysis of U.S. Census American Community Survey data.
  6. Ibid.
  7. Partnership analysis of data provided by MTA, WMATA, and GRTC.
  8. Ibid.
  9. "Better Boarding, Better Buses: Streamlining Boarding & Fares," National Association of City Transportation Officials and TransitCenter, 2017, https://nacto.org/wp-content/uploads/2017/02/NACTO_Better-Buses_Boarding.pdf.
  10. “TransitCenter’s NTD Transit Ridership Analysis, 2002-2017,” TransitCenter, May 2018. https://transitcenter.org/2018/05/01/ transitcenters-ntd-transit-ridership-analysis-2002-2017.
  11. Buehler, Ralph, John Pucher, and Oliver Dümmler. “Verkehrsverbund: The evolution and spread of fully integrated regional public transport in Germany, Austria, and Switzerland.” International Journal of Sustainable Transportation (2018). https://www.tandfonline.com/doi/full/10.1080/15568318.2018.1431821?scroll=top&needAccess=true.
  12. Partnership analysis of ridership data.
Expand to learn moreCollapse

Action 3.1

Increase the Speed and Reliability of Baltimore’s Transit System While Establishing a Bold Vision for an Expanded System

What

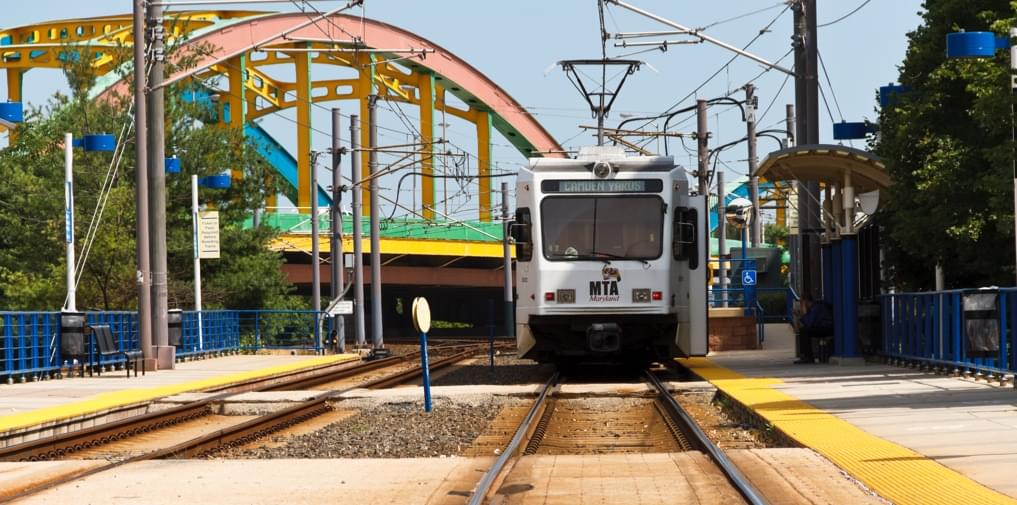
The Baltimore metro area has multiple modes of public transportation, including several types of rail and the 13th largest bus system in the country.1 However, public transportation in Baltimore remains underutilized and underperforming. Baltimore’s transit network has not kept pace with suburban job growth, nor is it positioned to capture a greater share of travelers as the metro area’s population grows in the coming decades. Though performance has been difficult to track due to lack of regular reporting, Baltimore’s buses appear to be struggling to reach performance goals even following the launch of BaltimoreLink, which redesigned bus routes throughout the metro area. At the same time, the subway and light rail face unmet repair needs.

The Baltimore metro area has not had a comprehensive transit vision in more than a quarter century. The proposed east-west Red Line light rail was the result of a 2002 rail expansion plan, and had been the metro area’s signature new project until its cancellation by the governor in 2015. Regional leaders have not yet developed a collective new vision for the system and must now focus on aligning interests and building consensus on a path forward. The newly authorized Central Maryland Regional Transit Plan Commission presents a once-in-a-generation opportunity to establish a new vision and strategy for advancing public transportation in the Baltimore area.

Public Transportation Comparison Among 11 Peer Regions

Metro Area Percent Transit Commuters Avg. Drive Alone Commute Time (Min.) Avg. Commute Time (Min.) Percent Increase on Transit
New York 31% 29 52 76%
Washington 14% 32 48 50%
Boston 13% 29 47 61%
Chicago 12% 29 50 70%
Philadelphia 10% 28 48 72%
Baltimore 7% 29 55 88%
Pittsburgh 5% 26 41 57%
Buffalo 3% 21 39 87%
Cleveland 3% 24 47 95%
St. Louis 3% 25 49 96%
Detroit 2% 26 54 103%

Source: U.S. Census, American Community Survey

Why

Baltimore’s public transportation system is inconsistent with that of a globally competitive region. Steps should be taken now to return the system to a state of good repair and prepare it for future growth. Between 2010 and 2040, the Baltimore metro area is expected to add 373,360 people (a 14 percent increase) and 393,604 jobs (a 26 percent increase).2 Many of these jobs are expected to be in suburban areas.3 As of 2013, 61 percent of Baltimore-area workers had job sites in the surrounding counties; only about a quarter of workers were employed in the central city.4

The suburbanization of jobs has had, and will continue to have, significant consequences for Baltimore’s transportation network. Already, Baltimore has the longest average commute time by transit among 12 Northeastern and Rust Belt peer regions, and the third longest average auto commute. The average resident in the Baltimore metro area can access nearly 80 percent of the more than 1,369,000 jobs in the area within 45 minutes by car. Yet, public transportation provides the average Baltimore metro area resident access to 58,000 jobs within 45 minutes—just 6 percent of the number of jobs available by car in this timeframe.5

In light of these challenges, the Maryland General Assembly mandated the creation of the Central Maryland Regional Transit Plan Commission as part of the Maryland Metro/Transit Funding Act, passed in April 2018. The Commission will help the Maryland Transit Administration (MTA) prepare a Central Maryland Regional Transit Plan by October 1, 2020.6 The Plan will define goals for Baltimore-area public transportation and identify options for meeting those goals with a combination of existing and new public transportation assets. The Central Maryland Regional Transit Plan presents a unique opportunity to establish a world-class vision for the future of Baltimore’s public transportation and develop actionable strategies that will improve and expand service. The Plan, with support from the Commission, should focus on critical regional goals, including enhancing consumer benefits; improving the state of good repair and safety of the existing system; enhancing connections between the bus, light rail, subway, and commuter trains; and expanding the frequency and improving the reliability of service to underserved, low-income, and high no-vehicle areas in the region.

While the plan is being developed, MTA, the city, and the counties can make near-term improvements by moving forward ready-to-go projects. These could include:

  • Expanding service frequency and improving reliability for CityLink and LocalLink buses—particularly those that are overcrowded, serve major job centers, or fall far below MTA’s goals for on-time performance
  • Transforming North Avenue with continuous bus lanes and bike and pedestrian infrastructure
  • Establishing priority transit corridors through MOUs between MTA and local jurisdictions and delivering cost-effective bus priority improvements such as dedicated space, transit signal priority, bus bulbs, and enhanced fare payment options
  • Developing a master plan to induce affordable and market rate mixed-use transit-oriented development on state-owned properties near transit stations, including the West Baltimore Maryland Area Regional Commuter (MARC) station
  • Working with employers, piloting additional microtransit programs to fill gaps in the fixed-route network, along the lines of the pilot being developed for the BWI/Arundel Mills area

Benefits

A high-performing public transportation system in the Baltimore metro area will help the region achieve its goals for economic growth and equitable access to opportunity. Improved access to jobs throughout the region will enable more workers to participate in the regional economy and expand the pool from which employers can recruit talent. Seamless connections between transportation options such as subway, light rail, bus, and bikeshare will encourage more people to use these options—helping to mitigate congestion on major corridors. A well-functioning, fast, and frequent transit system can also encourage economic development and job creation in struggling and disadvantaged areas.

Barriers

As detailed in other sections of this Blueprint, Baltimore’s bus and rail systems are among the few transit systems in the country that are operated by a state agency rather than a regional authority or city department. Moreover, the Baltimore metro area encompasses multiple counties as well as a central city—each with different expectations for public transportation service and expansion. This situation can present a barrier to progress if state goals differ from those of the Baltimore metro area—or counties disagree with one another or with the city about public transportation needs.

Next moves

The Central Maryland Regional Transit Plan and supporting Commission should establish a bold transit vision and actionable plan that will improve economic outcomes and access to essential destinations for all consumers in the region. At the same time, MTA, the city, and the counties should continue to make near-term improvements that can markedly improve the performance of the existing system.

Next moves are:

  • MTA, in partnership with the Central Maryland Regional Transit Plan Commission, should create the region’s first comprehensive long-range transit plan in more than a quarter century. The plan should improve reliability and state of good repair for the existing transit system and prioritize investments to further expand and better connect people to jobs and essential destinations, including by improving rapid transit options in key east-west corridors such as Route 40
  • MTA, Baltimore city, and the area’s counties should deliver on ready-to-go projects while the plan is being developed, including projects to expand service frequency and reliability for the BaltimoreLink system
  • MTA should increase transparency and public reporting of real-time performance metrics for its bus and rail systems, including on-time performance by route and time of day

Costs

In the near term, costs to deliver these improvements are modest—ranging from a few hundred thousand dollars to several million. Some of these costs will be offset by increased fare revenue or additional property tax revenue from new development. In the long term, the Central Maryland Regional Transit Plan will likely include major capital projects that will cost hundreds of millions of dollars or more.

Citations:

  1. 2016 APTA Fact Book, Table 30 (2014 NTD data), http://www.apta.com/resources/statistics/Documents/FactBook/2016-APTA-Fact-Book.pdf.
  2. Maximize2040 Long Range Transportation Plan. Baltimore Regional Transportation Board, 2015.
  3. Ibid.
  4. Baltimore Regional Transit Needs Assessment. Baltimore Metropolitan Council, 2015.
  5. Greater Washington Partnership analysis generated using Citilabs Sugar Dataset, which includes 2007-2011 ACS Data, 2012-2016 ACS Data, 2015 Longitudinal Employer-Household Dynamics Data, and Citilabs transportation networks.
  6. “Maryland Metro/Transit Funding Act.” HB 0372. Reg. Sess. of 2018. Maryland State Legislature. April 25, 2018. http://mgaleg.maryland.gov/webmga/frmMain.aspx?pid=billpage&stab=01&id=hb0372&tab=subject3&ys=2018RS
Expand to learn more Collapse

Action 3.2

Optimize Washington’s Bus Network and Enhance Coordination of the Metro Area’s Public Transportation Options
What

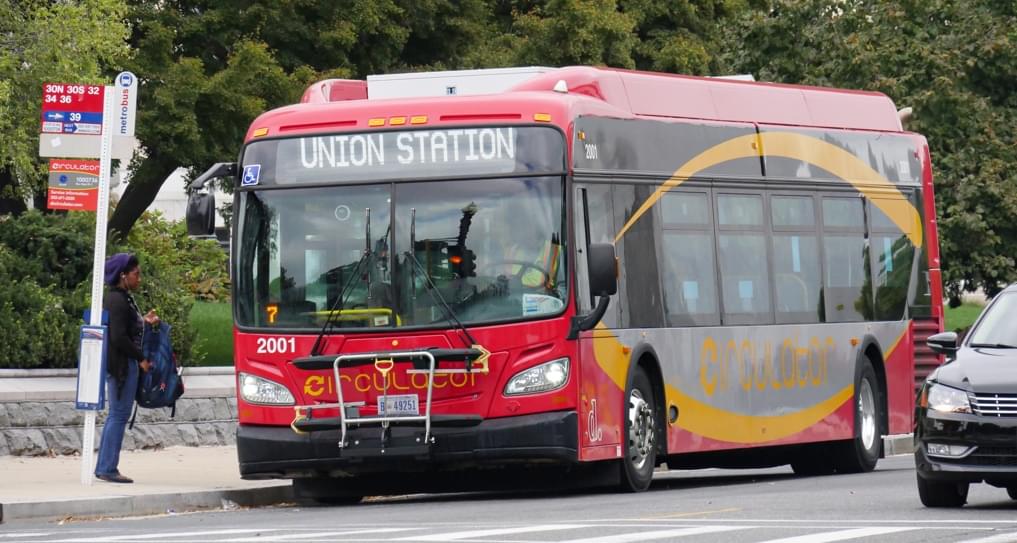
While Metrorail has been the primary transit focus of policy makers in recent years, bus service in the Washington area also needs improvements to better meet travel demand and ensure fast, reliable trips. For buses to compete with other mobility options in the future, local jurisdictions must improve bus speed and reliability by using dedicated lanes and signal priority on high-ridership, congested corridors.

In total, the Washington metro area has 18 transit operators,1 providing the region many different public transportation options—as well as bikeshare, carshare, and rideshare—to complete a trip. However, these services are not well coordinated, and operations are not standardized — creating unnecessary barriers to improvement and innovation.

A coordinating body that facilitates consultation and agreement between these various transportation agencies would allow the region to better integrate services, rationalize fares, conduct coordinated planning, share facilities, and offer one-stop shopping for customer information.

Why

In 2018, Maryland, Virginia, and the District agreed to provide an additional $500 million in annual dedicated funding to address the Washington Metropolitan Area Transportation Authority’s (WMATA) capital funding shortfall. This historic action will ensure a strong start in fixing many of the maintenance and safety issues that have plagued the Metrorail system in recent years. Attention must now turn to improving the Washington metro area’s bus systems, which provide 600,000 trips each weekday,2 as well as creating the governance structure needed to deliver the seamless, efficient public transportation system the Washington metro area requires.

Bus trips in the Washington area take longer than they used to in the past; as traffic congestion has increased, average Metrobus speeds have dropped 6.5 percent since 2010.3 On average, about one in five buses is more than two minutes early or seven minutes late in serving its stops.4 Slow, unreliable service is not competitive with other trip options (which have multiplied in the region). Since 2010, bus ridership across all transit providers in the Washington metro area has dropped 8 percent.5

Unlike Richmond and Baltimore, the Washington metro area has never had a comprehensive bus system re-design or strategy. Many bus routes are decades old and, while some continue to have high ridership, others may need to be adjusted to serve today’s needs. County- and city-provided bus services have grown tremendously in the past few decades, but parts of the region still remain underserved. A comprehensive, regionwide effort to optimize bus routes, schedules, and marketing to better match demand could improve travel for current bus riders and attract additional riders without significantly increasing costs.

WMATA has initiated a regionwide strategy to deploy faster service on 24 high-ridership corridors, known as the Priority Corridor Network (PCN). County transit agencies are exploring similar services on some of their high-demand routes. However, implementation has been slow, due in part to the fact that the Washington area’s roads have many different owners—each with its own policies regarding transit signal priority, bus-on-shoulder, dedicated bus lanes, and other bus priority treatments. A strategy that spans the entire Washington metro area would create a clear understanding of when such treatments are warranted (for example, through adoption of an MOU on goals or standards for bus service) and the process for implementing them.

With 18 transit operators, several bikeshare and rideshare companies, and multiple jurisdictions, implementing common policies and technologies has been challenging. For example, SmarTrip cards are accepted on WMATA and local buses, but not on Virginia Railway Express (VRE) or Maryland Area Regional Commuter (MARC) commuter rail. VRE riders can board Fairfax Connector buses for free at a VRE station, but cannot board VRE for free when returning to the station by bus. Importantly, there is no single website that provides fare and transfer information for all transit services in the area, though WMATA’s and other trip planning websites include some fare information. As WMATA and other local agencies explore mobile trip payment options, the need for a coordinated approach becomes even more important.

Benefits

Other regions have successfully used tools such as bus route redesigns and bus priority treatments to turn their transit systems around. For example, Seattle used a combination of dedicated bus lanes, priority movement for buses at key intersections, higher frequency on the most popular routes, and faster fare payment to make its buses faster, more reliable, more accessible, and easier to use. As a result, Seattle’s bus ridership has continued to grow—up 16 percent since 20106—while most other bus systems are shedding riders.

International peers are far ahead of U.S. transit agencies when it comes to regional coordination. Eighty-five percent of all Germans and 100 percent of all Austrians are served by regional public transportation associations (called Verkehrsverbund), which integrate services, fares, and ticketing for all public transportation options—bus, subway, and commuter rail—in that region.7 The associations also coordinate public transport planning, schedules, marketing, and customer information.

By working together, the various public transportation agencies across a region can offer higher-quality service and attractive fares, which have resulted in growing ridership and declining use of private vehicles. In Hamburg—a metro area with roughly the same population served as WMATA—the public transportation association coordinates 29 public transportation operators and has successfully grown ridership across the metro area by 72 percent from 1990 to 2015, to more than 750 million trips annually—nearly twice as many trips as WMATA provided in 2015.8

Barriers

Comprehensive changes to bus routes, schedules, fare policies, road treatments, and regional transit integration take time, commitment, and coordination by multiple parties, including significant public outreach to gain community input about goals and priorities. Such efforts have taken several years in other regions and required consistent political leadership to make the bus route optimization and integration of services a priority—something that has not been present in the Washington metro area thus far. Political leadership will also be required to make a new coordinating body effective.

Next moves

A coordinated, comprehensive optimization of bus service in the Washington area—coupled with targeted roadway treatments such as bus-only lanes and transit signal priority—will generate increased ridership, contribute new fare revenues, and make operations more efficient (which is a priority given the cap on increases in the operating budget attached to the new dedicated funding). Further coordination by a new entity to implement fare policy changes and technological improvements across all public transportation providers in the Washington metro area will help remove existing barriers to public transportation use and give consumers a seamless array of mobility options.

The next moves are:

  • The region’s transit providers—Metropolitan Washington Council of Governments (MWCOG), Maryland Department of Transportation (MDOT), District Department of Transportation (DDOT), Virginia Department of Rail & Public Transportation (DRPT), and Northern Virginia Transportation Commission (NVTC) should establish a new Public Transportation Coordinating Committee with responsibility for coordinating and standardizing fare policies, schedules, marketing, new technology integration, customer information, and planning across all public transportation systems in the Washington metro area
  • WMATA should coordinate with local jurisdictions and MDOT, DDOT, and VDOT to harmonize bus service across all providers in the Washington metro area
  • Local jurisdictions, MDOT, DDOT, VDOT, WMATA and other transit providers should establish regional policies for bus priority treatments
  • County and city governments should quickly complete ready-to-go bus improvement projects, such as the District’s 16th Street and Downtown West bus priority projects and Montgomery County’s Bus Rapid Transit project on US 29

Costs

Other regions that have implemented a comprehensive bus redesign have been able to do so without significant impact to their operating budgets. Similarly, establishing a new coordinating body should be within most agencies’ existing budget capacity. As these actions can be expected to increase ridership, the additional fare revenue they generate will help offset their modest budgetary impact.

Citations:

  1. Includes all agencies providing service in the Washington MSA that reported to the National Transit Database in 2016. Of these, 14 provided more than 500,000 annual trips.
  2. National Transit Database, 2016.
  3. Ibid.
  4. Ibid.
  5. “TransitCenter’s NTD Transit Ridership Analysis, 2002-2017,” TransitCenter, May 2018. https://transitcenter.org/2018/05/01/transitcenters-ntd-transit-ridership-analysis-2002-2017.
  6. Ibid.
  7. Buehler, Ralph, John Pucher, and Oliver Dümmler. “Verkehrsverbund: The evolution and spread of fully integrated regional public transport in Germany, Austria, and Switzerland.” International Journal of Sustainable Transportation (2018). https://www.tandfonline.com/doi/full/10.1080/15568318.2018.1431821?scroll=top&needAccess=true.
  8. Ibid.
Expand to learn more Collapse
Action 3.3

Expand Rapid Transit Options to Better Connect Consumers with Essential Destinations Throughout the Richmond Metro Area

What

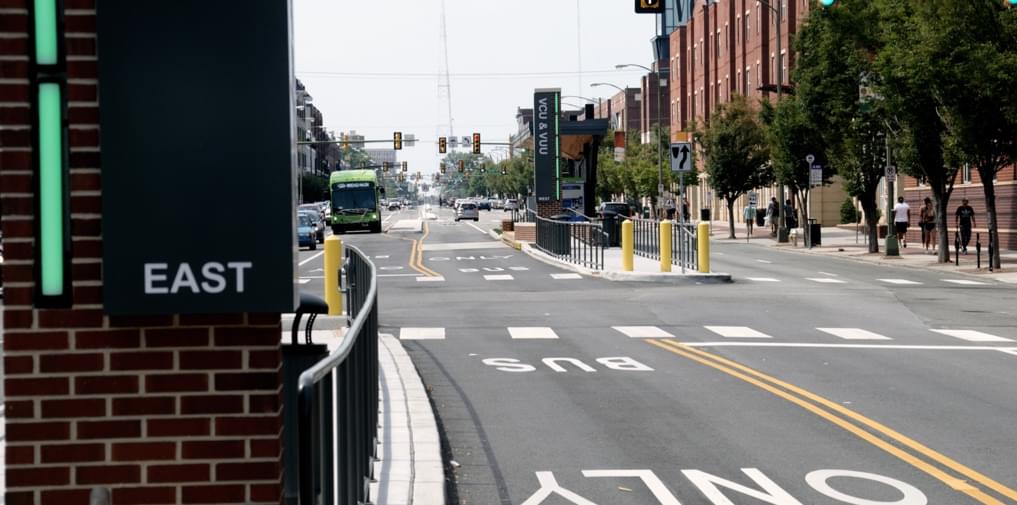
On June 24, 2018, the Greater Richmond Transit Company (GRTC) launched a new bus rapid transit (BRT) line and a comprehensive redesign of bus routes in the city of Richmond as well enhanced service in Henrico County1. In September 2018, newly expanded bus service began in Henrico County to serve Short Pump, a major employment center, every 30 minutes during the week and on weekends—the largest bus transit expansion for Henrico in over 25 years.2 While these improvements represent big steps forward, many jobs in the counties surrounding Richmond remain inaccessible by transit. The region should continue to enhance transit service in the city and invest in additional fixed-route bus service in surrounding counties to improve access to jobs and services for the metro area’s residents.

Households Near Weekday Bus Service (AM Peak)

Metro Area % of Households Within 1/4 Mile of A Bus Stop % of Low-Income Households Within 1/4 Mile of a Bus Stop
Capital Region 59% 75%
Baltimore 67% 85%
Washington 82% 91%
Richmond 28% 53%

Households Near Weekend Bus Service (Sunday AM)

Metro Area % of Households Within 1/4 Mile of A Bus Stop % of Low-Income Households Within 1/4 Mile of a Bus Stop
Capital Region 42% 61%
Baltimore 52% 76%
Washington 56% 72%
Richmond 16% 35%
Note: Low-income household figures are based on ACS 5-year threshold levels that compare income and number of people or families.
Source: Citilabs Data and LEHD Origin-Destination Employment Statistics.

Why

In parts of Henrico County and nearly all of Chesterfield County—the two counties surrounding the city, and home to nearly 52 percent of the Richmond metro area’s jobs3—thousands of people and jobs remain disconnected by public transportation from the rest of the region. County residents without regular access to a car are unable to access jobs in their own jurisdiction—let alone neighboring jurisdictions—and city residents cannot get to jobs, healthcare, or educational facilities in the counties by public transportation.

The average resident in the Richmond metro area can access just over 80 percent of the more than 621,000 jobs within 45 minutes by car.4 In contrast, public transportation provides the average resident access to only 21,000 jobs within 45 minutes—just 3 percent of the jobs available to drivers in this time frame. In Chesterfield County, the average public transportation consumer can access just 1 percent of jobs compared to a driver.

The City of Richmond and Henrico County recently invested in historic transit improvements, including the Pulse BRT, a 7.6-mile route from Rocketts Landing in the city of Richmond to Willow Lawn in Henrico County. At the same time, the city of Richmond launched the Greater Richmond Reroute, a comprehensive redesign of the city’s bus network, to enhance connections and service. A few months later, Henrico County made its largest investment in more than a quarter century, expanding frequencies and hours of service on three important routes. Infrastructure improvements and bus priority treatments along high-ridership corridors will not only maximize the benefits of the Pulse; they will also lay the groundwork for increased ridership and future BRT lines.

The Richmond metro area has completed planning efforts to identify needed transit improvements. The Greater RVA Transit Vision Plan—completed by the Virginia Department of Rail and Public Transportation (DRPT) and the Richmond Regional Transportation Planning Organization—lays out a tiered network of BRT, express, and local bus routes that would increase ridership by 107 percent by 2040.5 Henrico County also invested in an analysis of its transit routes.6 These plans provide a road map for improving transit in the region, but lack a clear implementation strategy.

Benefits

Quality rapid transit connections can be a leading driver for economic development—as witnessed in Cleveland, with the Health Line BRT project. The Health Line opened in 2008 at a cost of $200 million and connects downtown to Case Western University and University Circle—two leading activity centers in the state—with seven miles of dedicated bus lanes and frequent, 24-hour bus service.7 Since its opening, the project has attracted over $6 billion of investment and rejuvenated the corridor, which previously included many areas suffering from multi-generation decline.8

Lack of accessible and reliable transportation can also hold back the region’s economic potential and present a significant barrier to finding and holding a job—and to upward economic mobility. More frequent and reliable public transportation in the Richmond area will improve access to essential destinations—opening up a wider range of employment and educational opportunities for residents.

Transit use in the Richmond metro area has been below average compared to other U.S. cities with similar populations. This underperformance is a reflection of the small amount of service provided and the reality that the area’s residents must get by without access to vital public transportation options. While the recent route redesign, new Pulse BRT, and expanded service in Henrico County are positive steps forward—and should make transit a more competitive option for consumers in Richmond—a number of Richmond’s southern peers are moving ahead with more expansive transit plans (e.g., Durham and Charlotte are both planning major transit improvements). Richmond should continue to advance transit expansion and improvements in order to remain competitive with its neighbors and contribute to the continuing growth of the Capital Region.

Barriers

As outlined in other sections of this Blueprint, the Richmond area lacks the ability to tax itself to help pay for the costs of expanding public transportation. Moreover, county leaders have little experience to draw from when it comes to public transportation, so pursuit of collaborative initiatives and educational efforts will be important.

Next moves

Expanded transit service in the Richmond metro area will require concerted leadership from GRTC and city and county officials. Funding must be identified—and long-term changes to governance structures may be required to ensure appropriate oversight.

The next moves are:

  • GRTC should work with leaders in Chesterfield County to identify appropriate corridors for fixed-route service and develop a path toward implementation
  • GRTC should work with the counties and city to implement the network envisioned in the Greater RVA Transit Vision Plan, including faster, more frequent, and more reliable service on key east-west and north-south corridors such as the Jefferson Davis Highway/Route 1 corridor connecting Ashland to Chester
  • The City of Richmond should develop a new multimodal transportation plan, with specific bus prioritization strategies

Costs

Expanding transit service comes with additional capital and operating costs, though the exact cost will depend on the number of new or expanded routes as well as revenue received from ridership levels. The Richmond metro area does not have a regional funding mechanism to pay for transit service. As a result, until a regional source is secured, each jurisdiction would need to increase annual operating and capital investments to support new service.

Citations:

  1. “GRTC Pulse Begins Service Today.” GRTC Transit System, June 2018. http://ridegrtc.com/news-initiatives/press-releases/grtc-pulse-begins-service-today/
  2. “GRTC Service Updates: September 16, 2018.” GRTC Transit System. http://ridegrtc.com/news-initiatives/news-updates/grtc-service-updates-september-16-2018
  3. Partnership analysis of Richmond metro area job locations.
  4. Greater Washington Partnership analysis generated using Citilabs Sugar Dataset, which includes 2007-2011 ACS Data, 2012-2016 ACS Data, 2015 Longitudinal Employer-Household Dynamics Data, and Citilabs transportation networks.
  5. “Greater RVA Transit Vision Plan.” DRPT and RRTPO, 2016. http://www.drpt.virginia.gov/media/2339/grtvp_final.pdf.
  6. “Henrico County Transit Choices Report.” Michael Baker International and Jarrett Walker + Associates, August 2017. http://ridegrtc.com/ media/main/Henrico_Transit_Choices_Report_-_August_2017_Print_ Quality.pdf.
  7. “Project: Cleveland’s Healthline Bus Rapid Transit (BRT).” TransForm, August 2014. http://www.transformca.org/best-practices-item/project-clevelands-healthline-bus-rapid-transit-brt.
  8. “Downtown Cleveland’s commuter options drive economic development.” Downtown Cleveland Alliance. American City Business Journals, June 2018. https://www.bizjournals.com/columbus/news/2018/06/01/downtown-cleveland-s-commuter-options-drive.html.
Expand to learn more Collapse

Contact Us

Phone Number

General Inquiries

202 765 2024

Email Address

[email protected] [email protected]
Sign Up For Updates