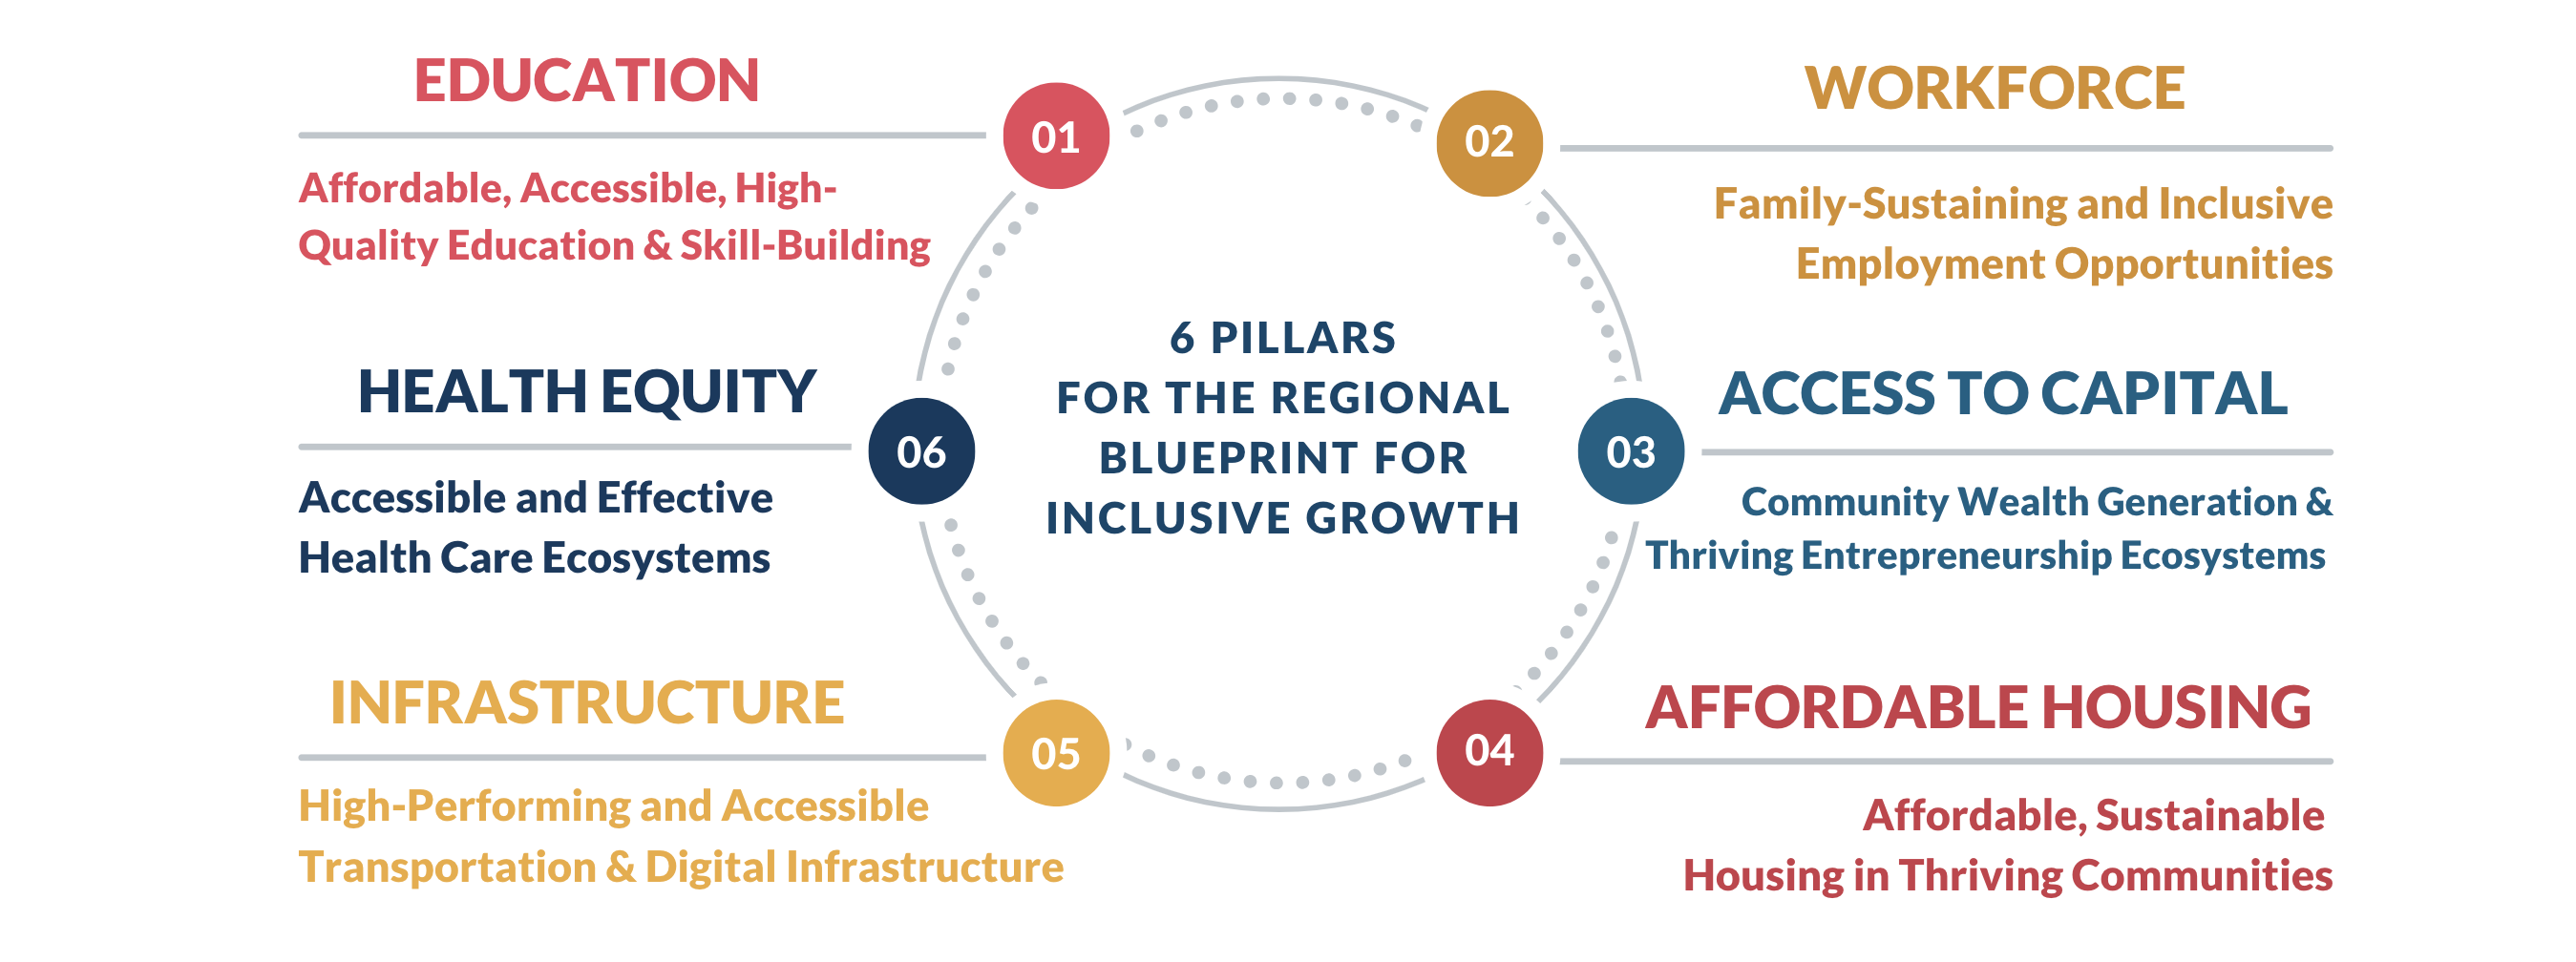
The Inclusive Growth Dashboard presents data on 45 metrics that track economic performance and inclusive growth across the Baltimore, Washington, and Richmond metro areas. It serves as a resource for understanding the region’s economic landscape and informing policies, programs, and investments that can lead to better outcomes in six key areas – workforce, education, access to capital, housing, infrastructure, and health.
Top-Line Insights: What the Data Tells Us
The latest data shows that housing supply, childcare support, and capital access remain top issues when it comes to ensuring the region grows inclusively. Some of the top takeaways for policymakers and business leaders across our region can be found below.
Affordable Housing: New housing construction declined the past two years in a row despite persistently high demand.
The region constructed 2,300 fewer housing units between 2023 and 2024 – a decline that follows an even larger drop in the year prior. Since 2020, median housing costs have risen by an average of 15% across the region’s metro areas, pushing people out of the region in search of a lower cost of living.
Workforce: The region’s high cost of living is a significant headwind to attracting and retaining residents, particularly families with young children.
The cost of childcare for two children surpasses 40% of median household income in Baltimore City and Washington, DC – the highest in the area. Across the region, it would take a quarter of the median household’s income to cover childcare costs, on average.
Education: For the first time, more than half of adults across the region have a bachelor’s degree or higher, but gaps persist.
In metro Washington, 55% of residents hold a postsecondary degree – surpassing many other highly educated metro areas, such as Boston and San Francisco. That compares with 44% in metro Baltimore and 42% in metro Richmond. Yet gaps persist, with a 23-percetage-point gap between Black and white residents across the region and a 30-percentage-point gap for the Hispanic population.
Access to Capital: Black and Hispanic residents make up a disproportionately smaller share of business owners relative to their presence in the workforce, but entrepreneurs have led new business formation in recent years.
Across the region, small business owners are less likely to be Black or Hispanic than their share of the workforce would suggest. In metro Richmond, for instance, these demographics make up 39% of workers yet own only 29% of businesses. But minority entrepreneurs are playing an outsized role in leading a recent surge in new business formation, with the number of new establishments growing by 25% across the region since 2020.
Infrastructure: Ridership on public transportation continues to rebound strongly across the region, already surpassing pre-pandemic levels in Richmond.
Transit ridership in Richmond was 28% higher than before the pandemic, even as usage across most other major cities continues to recover. Total rail and bus ridership on Washington Metropolitan Area Transit Authority (WMATA) reached 78% of pre-pandemic levels in 2024, while ridership on Maryland Transit Administration (MTA) services reached 76%.
Health Equity: The share of the region’s households receiving federal nutrition assistance ticked up in recent years, reversing declines recorded prior to the pandemic.
In metro Baltimore, nearly 11% of households relied on the Supplemental Nutrition Assistance Program (SNAP) to receive benefits that supplement their grocery budget in 2024. The share was 9.9% in metro Richmond and 7.8% in metro Washington.
To learn more about the Dashboard’s methodology, click here.
The Regional Blueprint for Inclusive Growth and Dashboard are tools produced by the Partnership’s Inclusive Economic Growth initiative, which works with business, government, academic, and nonprofit leaders to build programs and investments across the region that strengthen regional economic competitiveness.